
You know that feeling when you already looked at your data from all angles? You separated it based on gender, age, socioeconomic status and even location, but you still think there is more to discover? Factor and cluster analysis help you discover patterns in your dataset that go beyond simply splitting it up according to demographics, and in this blogpost we will explain how to best use both of them.
Segmentation is one of the fundamentals of survey research, it allows you to see the structure that underlies your data. This can be whether males are more likely to buy a certain product or whether older workers are more happy at work.
Segmentation can be done through purely descriptive statistics such as frequencies and averages. But there are also certain more advanced statistical techniques that can be used to detect patterns in datasets, factor and cluster analysis are two commonly used examples of those.
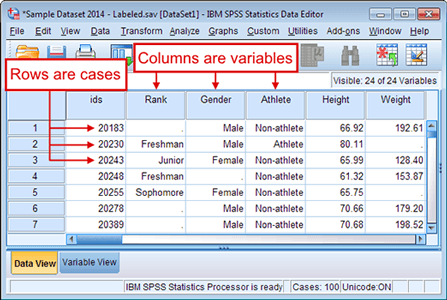
To start, however, a short note on terminology: with variables we mean the vertical sections of your dataset (generally the survey questions), with cases we mean the horizontal lines (generally the individual respondents in a survey dataset).
Factor analysis
Factor analysis is an advanced statistical technique that works based on correlation. Correlation explains the co-variation of certain variables, as shown on the graph below.
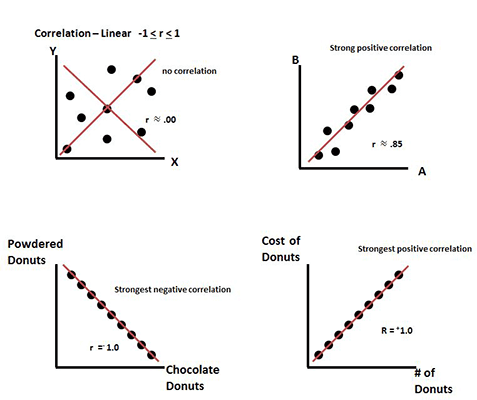
Factor analysis extends this principle and groups variables into new variables called factors based on correlation. Factors are the underlying or latent variables of your dataset if you will.
There are two types of factor analysis: exploratory and confirmatory. Exploratory refers to using factor analysis to explore the structure of a dataset, which is most often used for market research. Confirmatory factor analysis is more interested in how a factor explains certain variables and thus confirms certain hypotheses, which is most often used in scientific research.
Essentially exploratory factor analysis can help you find unexpected patterns in your variables. For example, survey data of people’s shopping habits might show how consumption of more expensive food at the supermarket is related to buying all kinds luxury goods, from expensive clothes to high-end electronics.
Cluster analysis
Where factor analysis looks at the groupings among variables (the vertical section of the dataset), cluster analysis looks at the groupings among cases (the horizontal sections of the dataset).
In the below image a very simple cluster analysis is represented, with cases (for example customers) being represented on a two axis graph (representing two variables). Cluster analysis then brings order in these cases and groups them into two clusters (generally based on some sort of distance calculation).
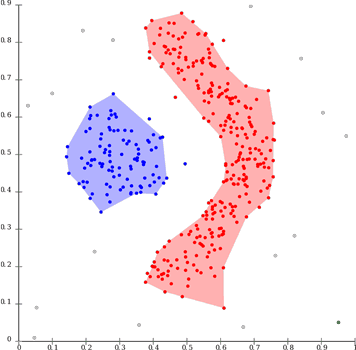
Unlike factor analysis, cluster analysis actually puts individual respondents in groups, which allows you to segment respondents and for example establish that 30% of your respondents belong to the group that likes high-end shopping.
Both techniques can also be used in parallel, with factor analysis to look for patterns and cluster analysis to actually segment your dataset.
Where to learn more?
Both of these techniques can be highly useful in finding undiscovered patterns in your data, yet you should also take care. Both use relatively complex statistics to establish patterns in your dataset, so knowledge of the techniques underlying them is key to make correct interpretations.
A good book to get your started is Multivariate Data Analysis, an almost classic textbook that explains these techniques in language understandable to non-experts.
A good knowledge of statistical software, like SPSS, is also a must to correctly do and interpret these techniques. You can find many guides for this online, at the following links for example you can find SPSS guides for both factor and cluster analysis from the University of Utrecht.
To do factor and cluster analysis, however, you should first collect your survey data. CheckMarket gives you all of the tools to do that, so you can go looking for the segments in your dataset. CheckMarket also allows you to download your data in the file format best for your statistical software.
Laisser un commentaire