
We are excited to announce the new Conjoint feature in CheckMarket! With Conjoint, you can now have an even deeper understanding of consumer preferences across varying marketing and product research use cases.
Whether your objective is to prioritize product features or functionality, or to understand how various messaging and product claims resonate with a target audience, you can now enable these objectives and beyond within CheckMarket.
What is Conjoint Analysis?
With choice-based conjoint analysis, survey respondents are shown a series of product offerings with varying attributes and asked to select the one they would most likely buy. By asking respondents to choose a product to actually buy, it yields more direct results than ranking systems.
Conjoint analysis is especially useful in designing a new product, product line extensions, estimating brand equity, measuring price sensitivity (elasticity), and branding and packaging. It’s helpful to understand answers to questions such as:
- Should we offer business class passengers more seat room or in-flight internet access?
- Should we offer a 2.5L engine or a 6.0L engine in the new SUVs?
It specifically helps determine how people value different attributes, features, functions, or benefits that make up an individual product or service versus having to rate each feature separately.
For example, customers may not be able to accurately express their valuations of different attributes and attribute levels, therefore we use Conjoint to ask customers to provide an overall evaluation for different bundles of attributes (i.e. products).
How Does Conjoint Work? Respondent Experience
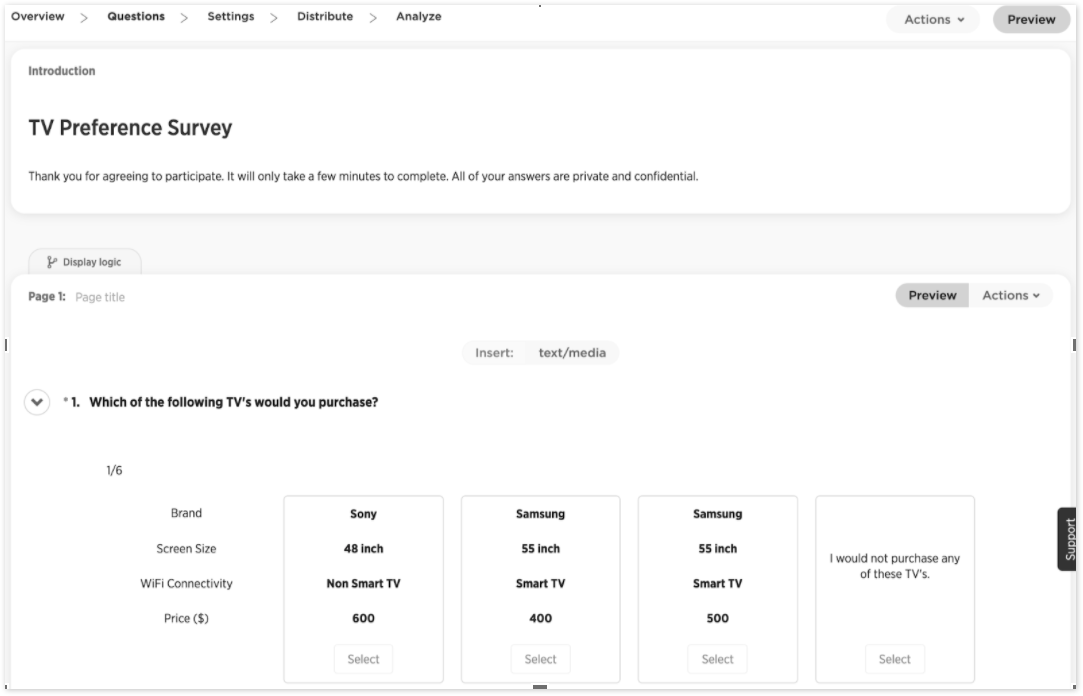
The respondents would see a set of specific Conjoint questions as follows. These questions could include either images or text as attributes in the question layout. Here’s an example of the Conjoint Question with text:
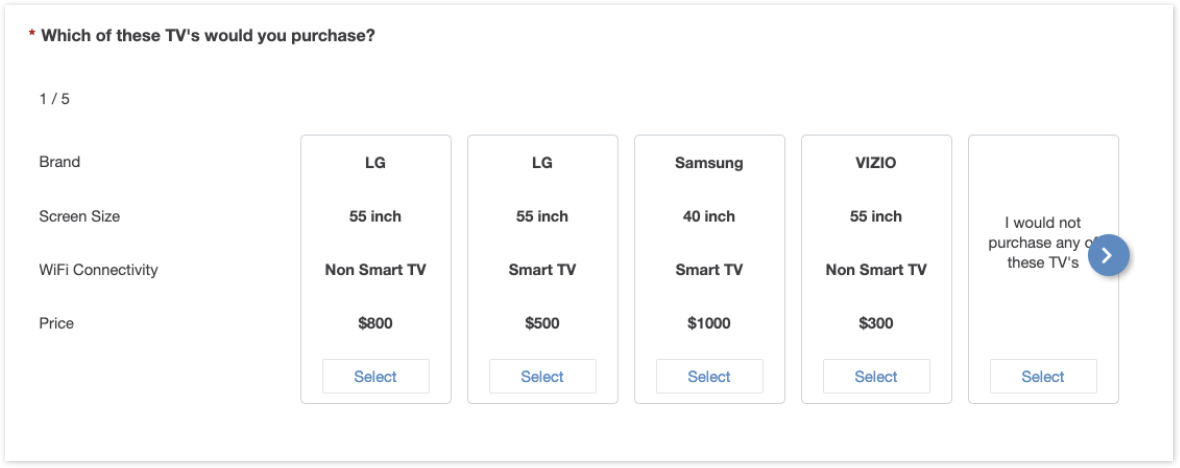
Each question will appear on a separate page. For each Conjoint question, the respondent will be required to evaluate the combination of attributes on each of the cards, and ultimately select which product offering is most favorable to them.
If the respondent decides to reconvene the survey at a later stage, the Conjoint questions and responses will be saved.
How Does Conjoint Work? Admin Experience
Now onto how you can start using Conjoint in your surveys.
With just a few clicks, you can enable a Conjoint question in CheckMarket. When you add a question within the survey set up, you will now see a new section for Choice Based Tools, where you’ll find the Conjoint question. We have also moved the existing MaxDiff question to this section.
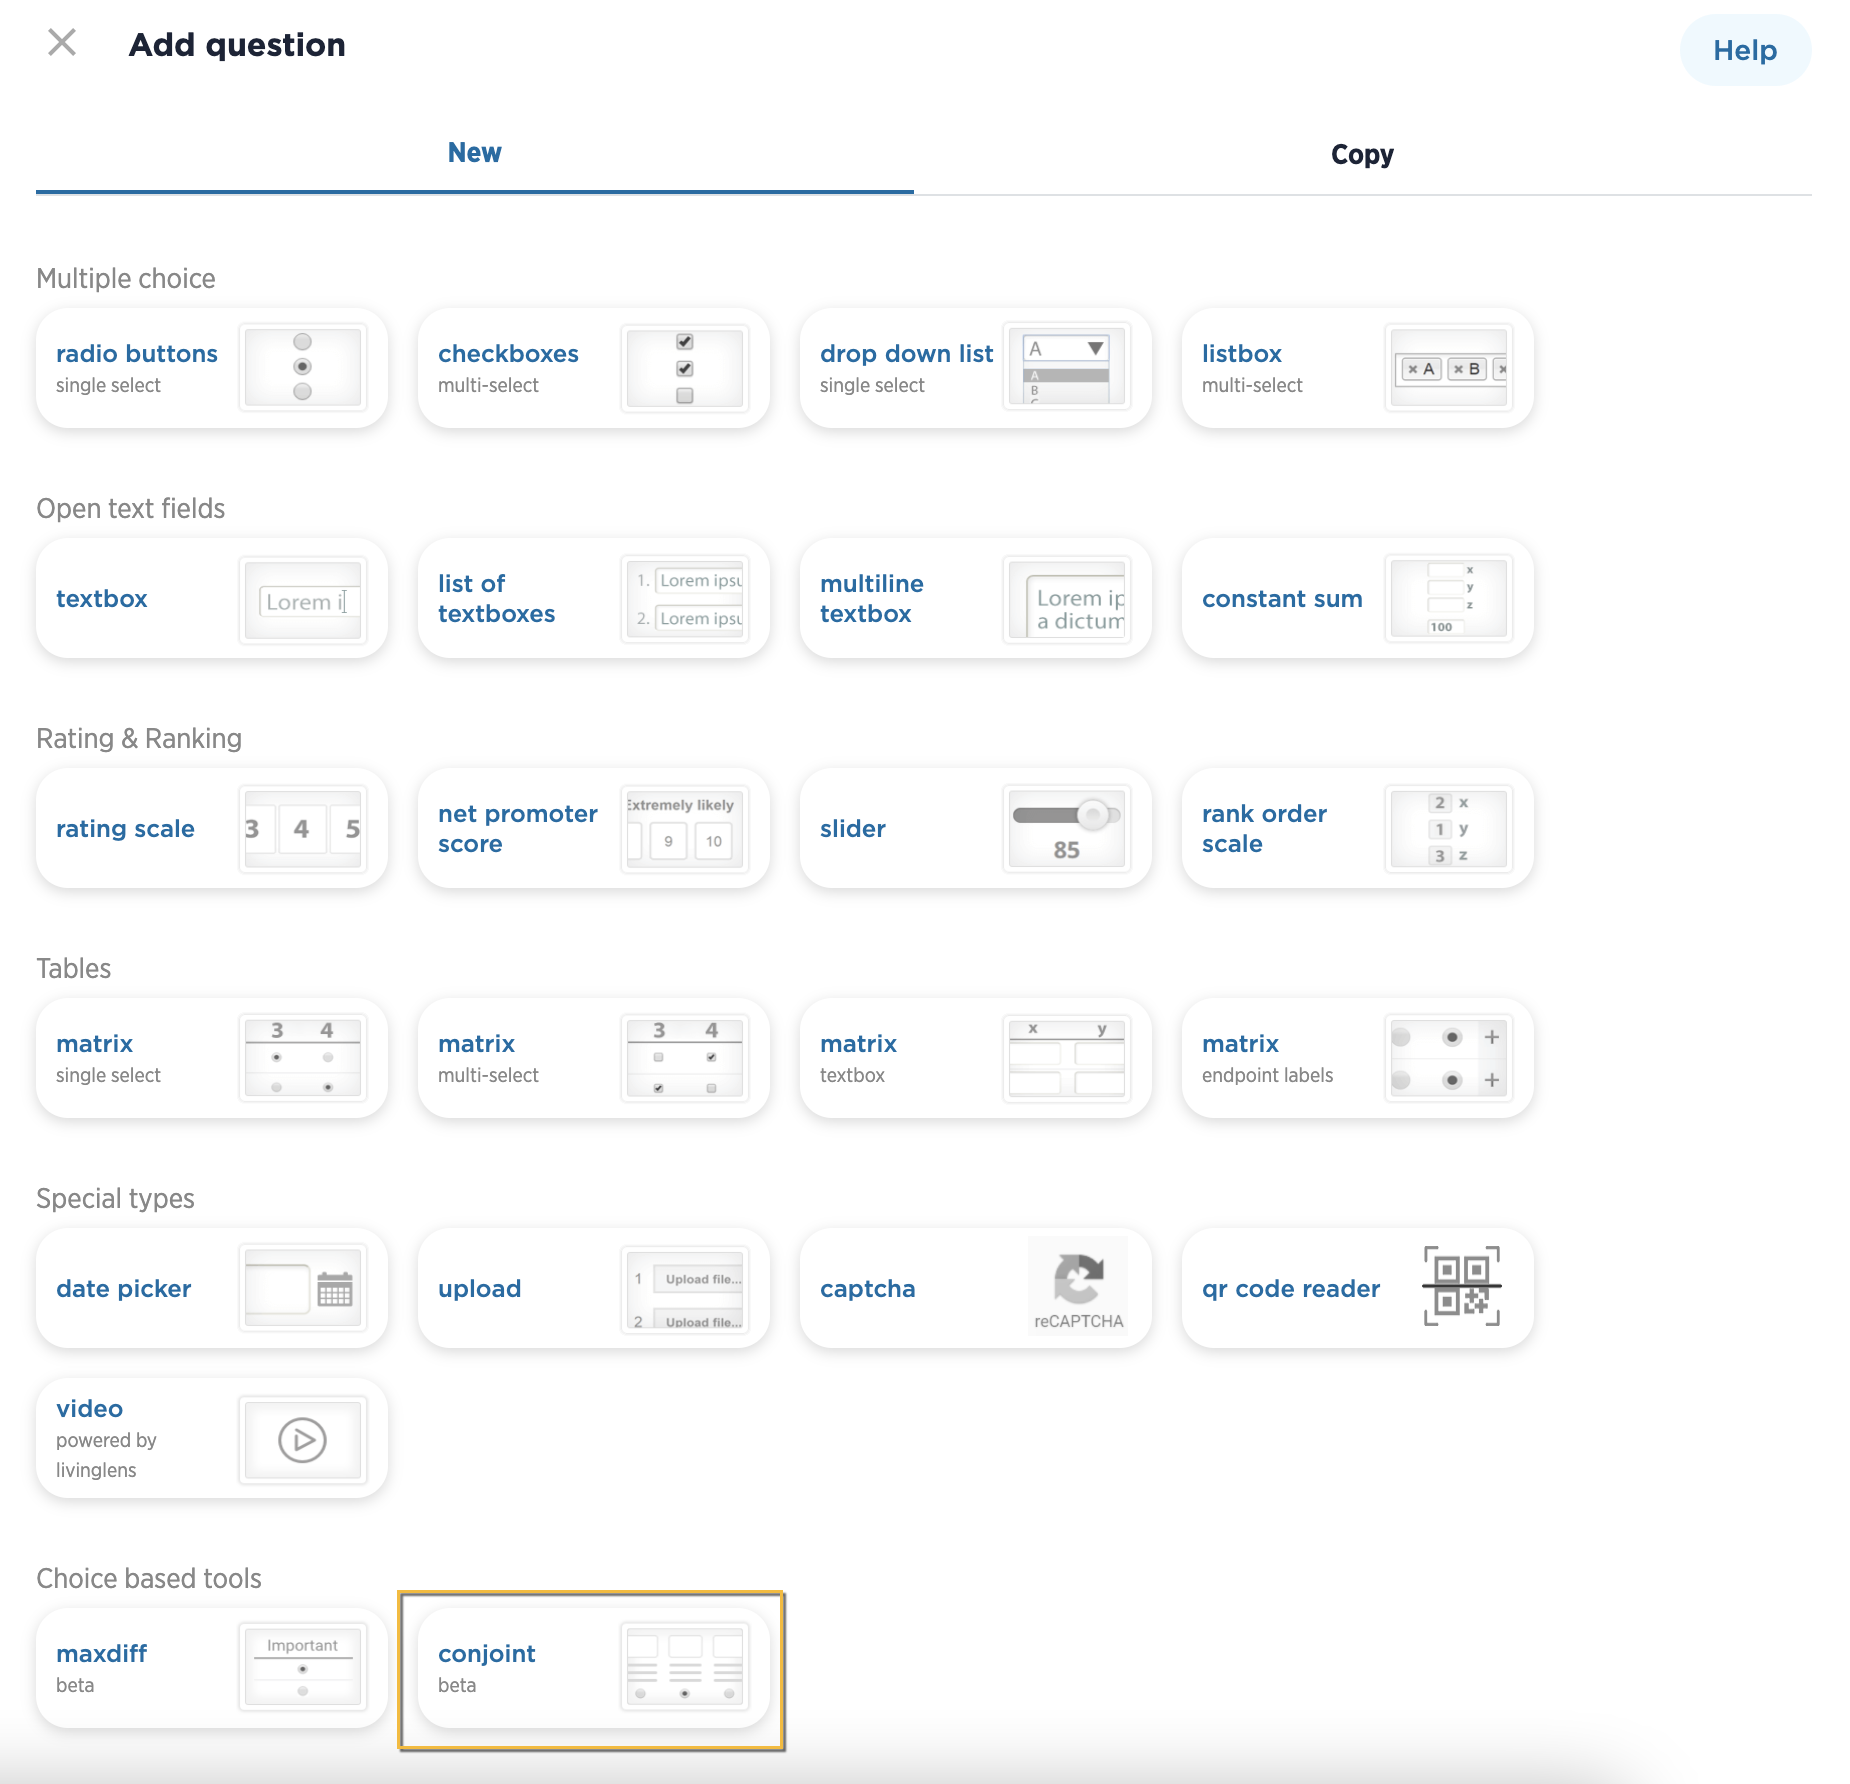
The Conjoint question includes 3 separate tabs: Question, Settings, and Prohibitions.
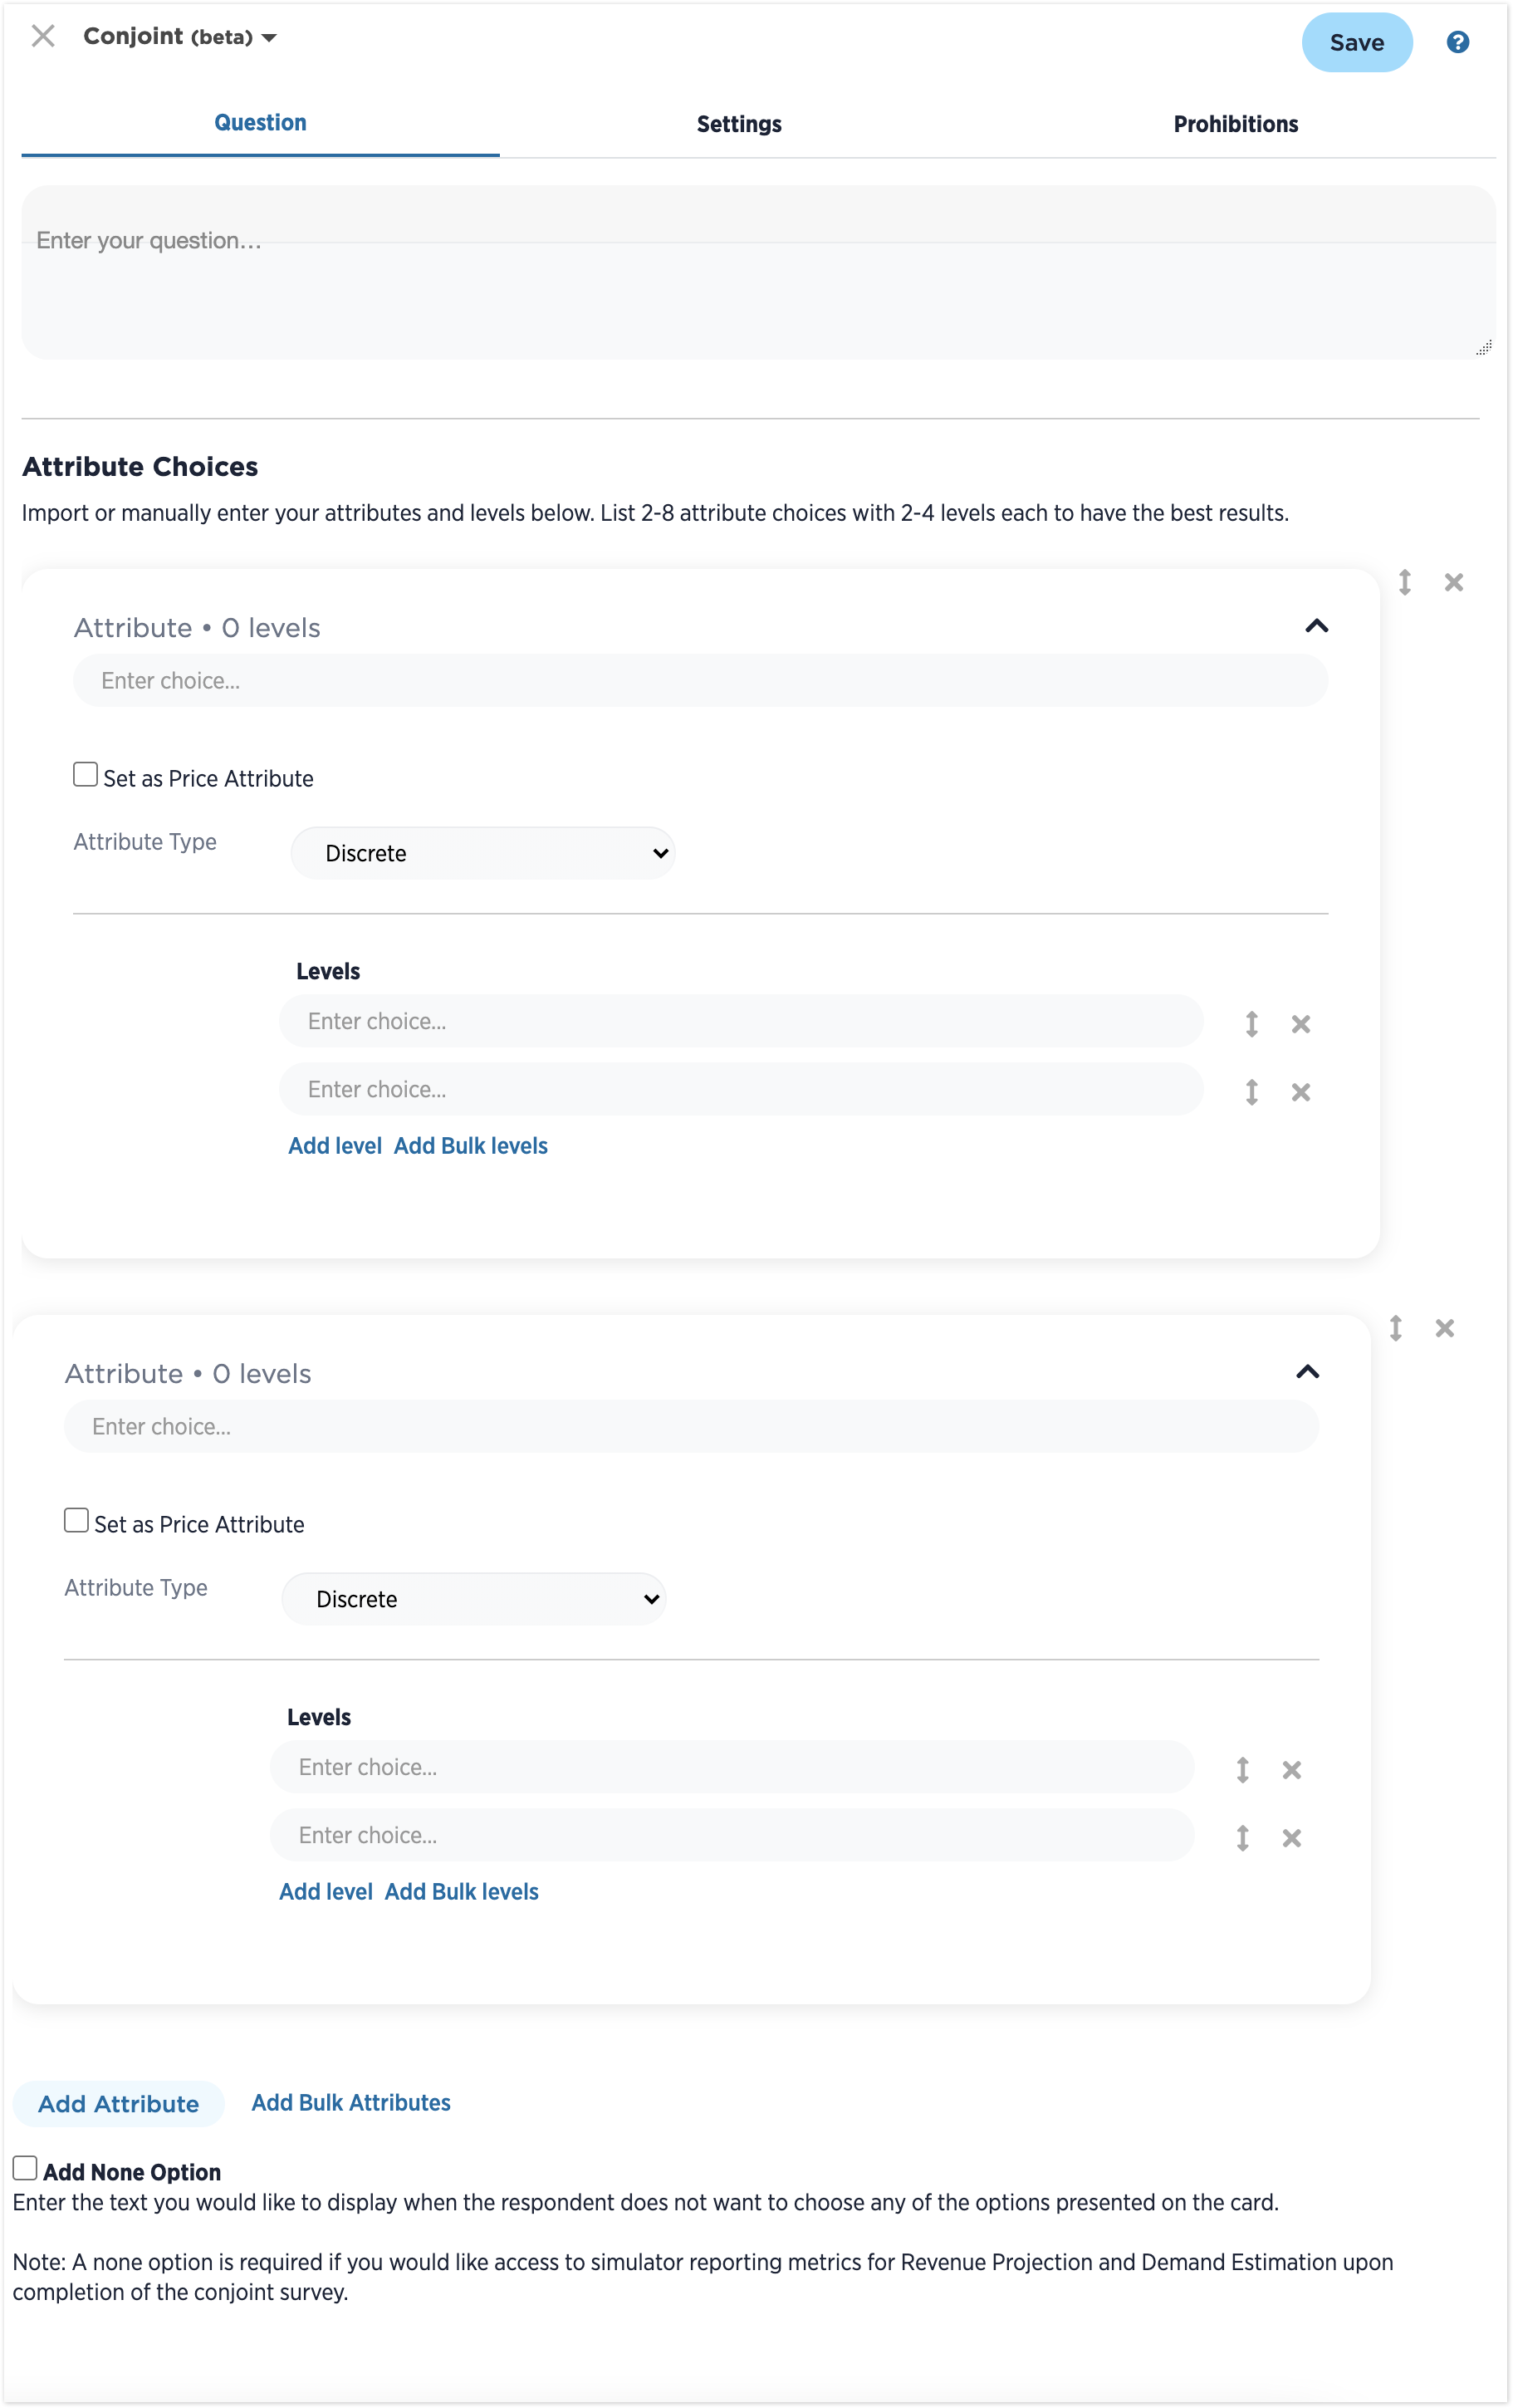
Questions Tab
Here, the admin user can enter the desired question or prompt (i.e. Select the option that is most appealing to you.) .
Attribute choices will include the complete list of options/items that need to be part of the study for the consumer preferences, along with corresponding levels for each attribute.
The default question setup will include two attributes with two levels each. A maximum of 10 attributes can be selected, with up to 7 levels per attribute.
Settings Tab
There are specific Conjoint Settings that define the survey design: the number of cards, and the number of concepts per card.
The maximum number of cards you’re able to display throughout a conjoint survey is 12 cards. On each card, you’ll be able to display up to 6 concepts per card.
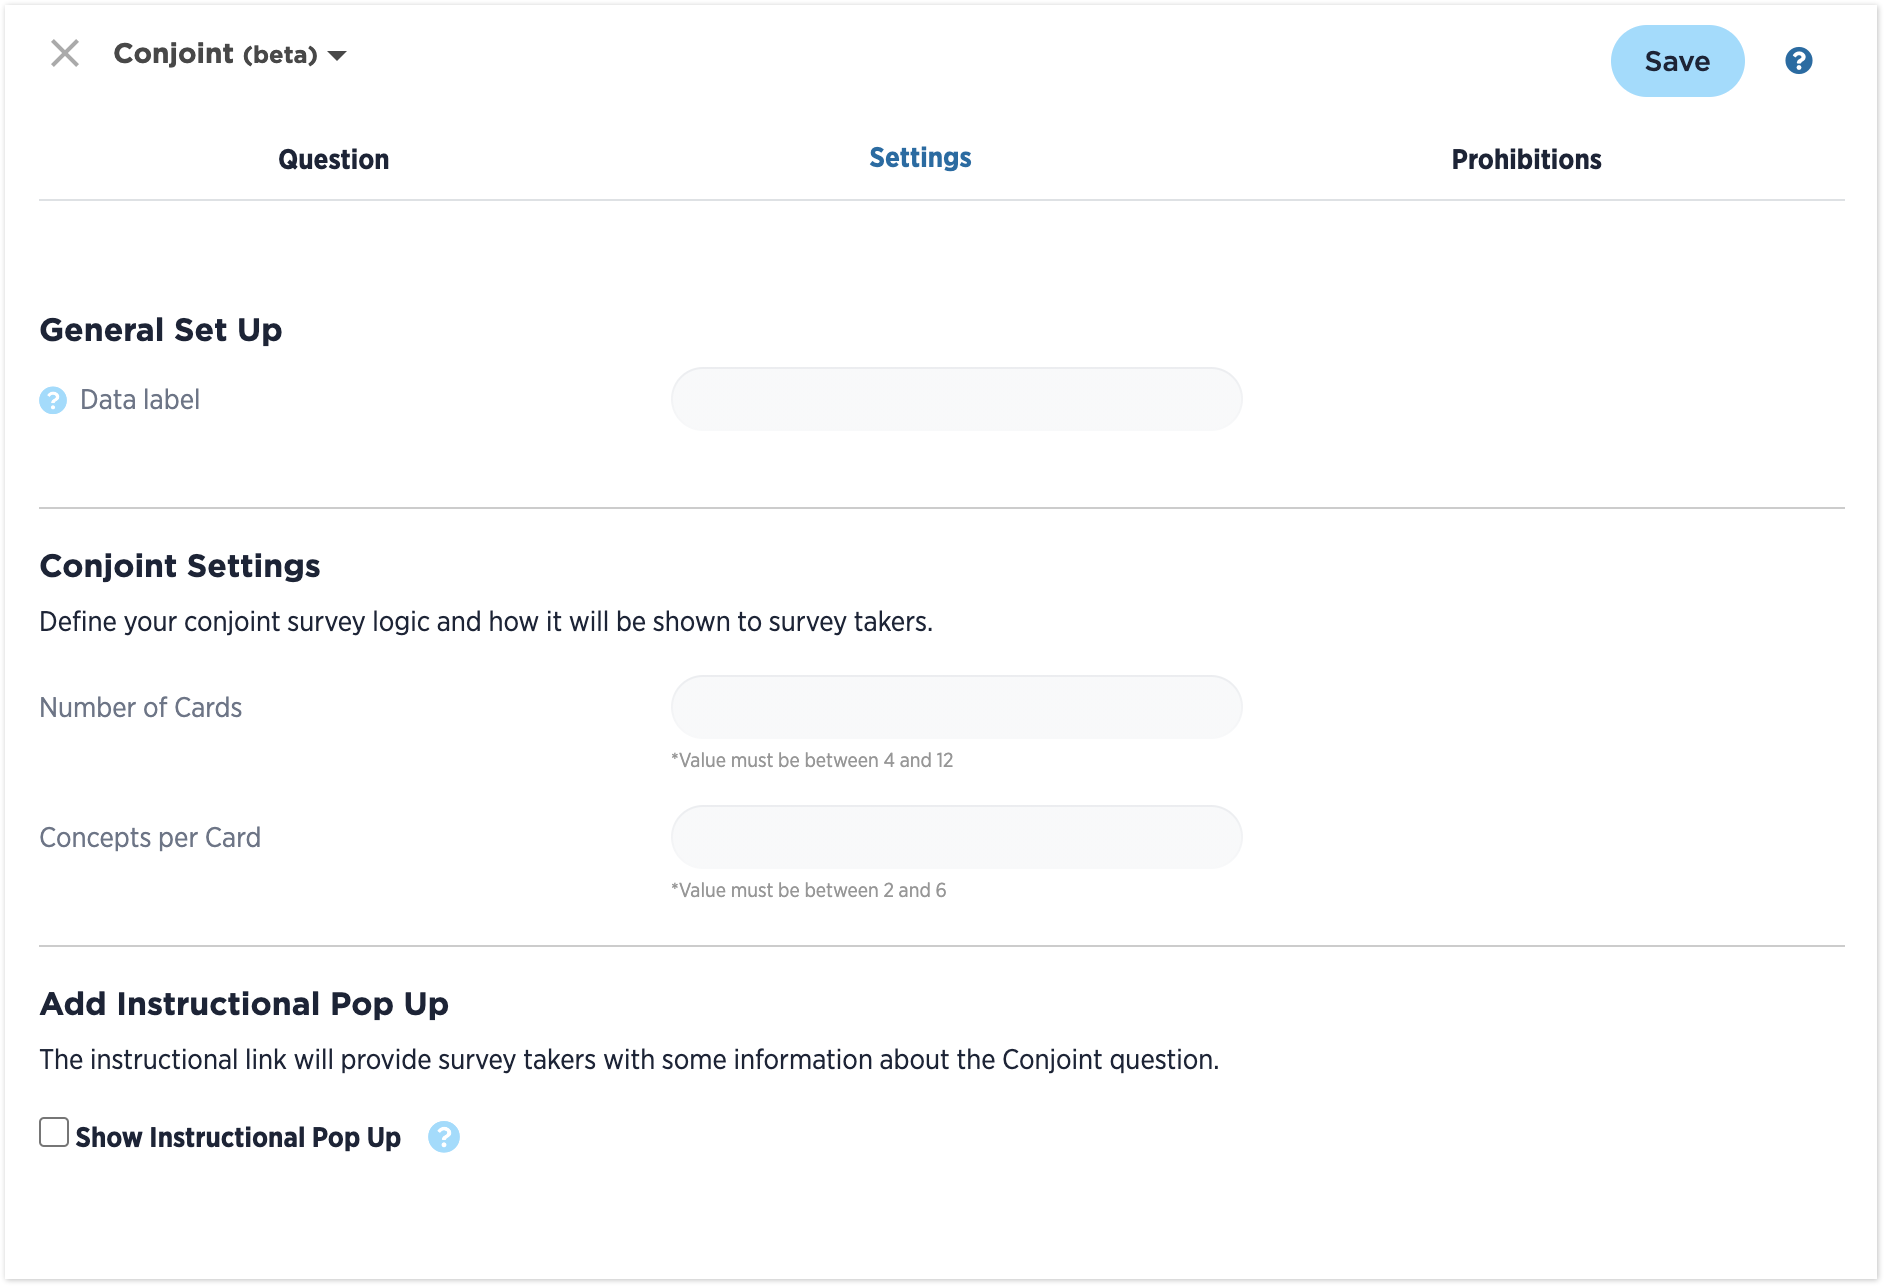
An admin can also choose to include an instructional pop up, which will be the first page that a user sees right before they start answering the conjoint study.enter in sample instructions. It will include instructional text as well as an example card with product concepts.
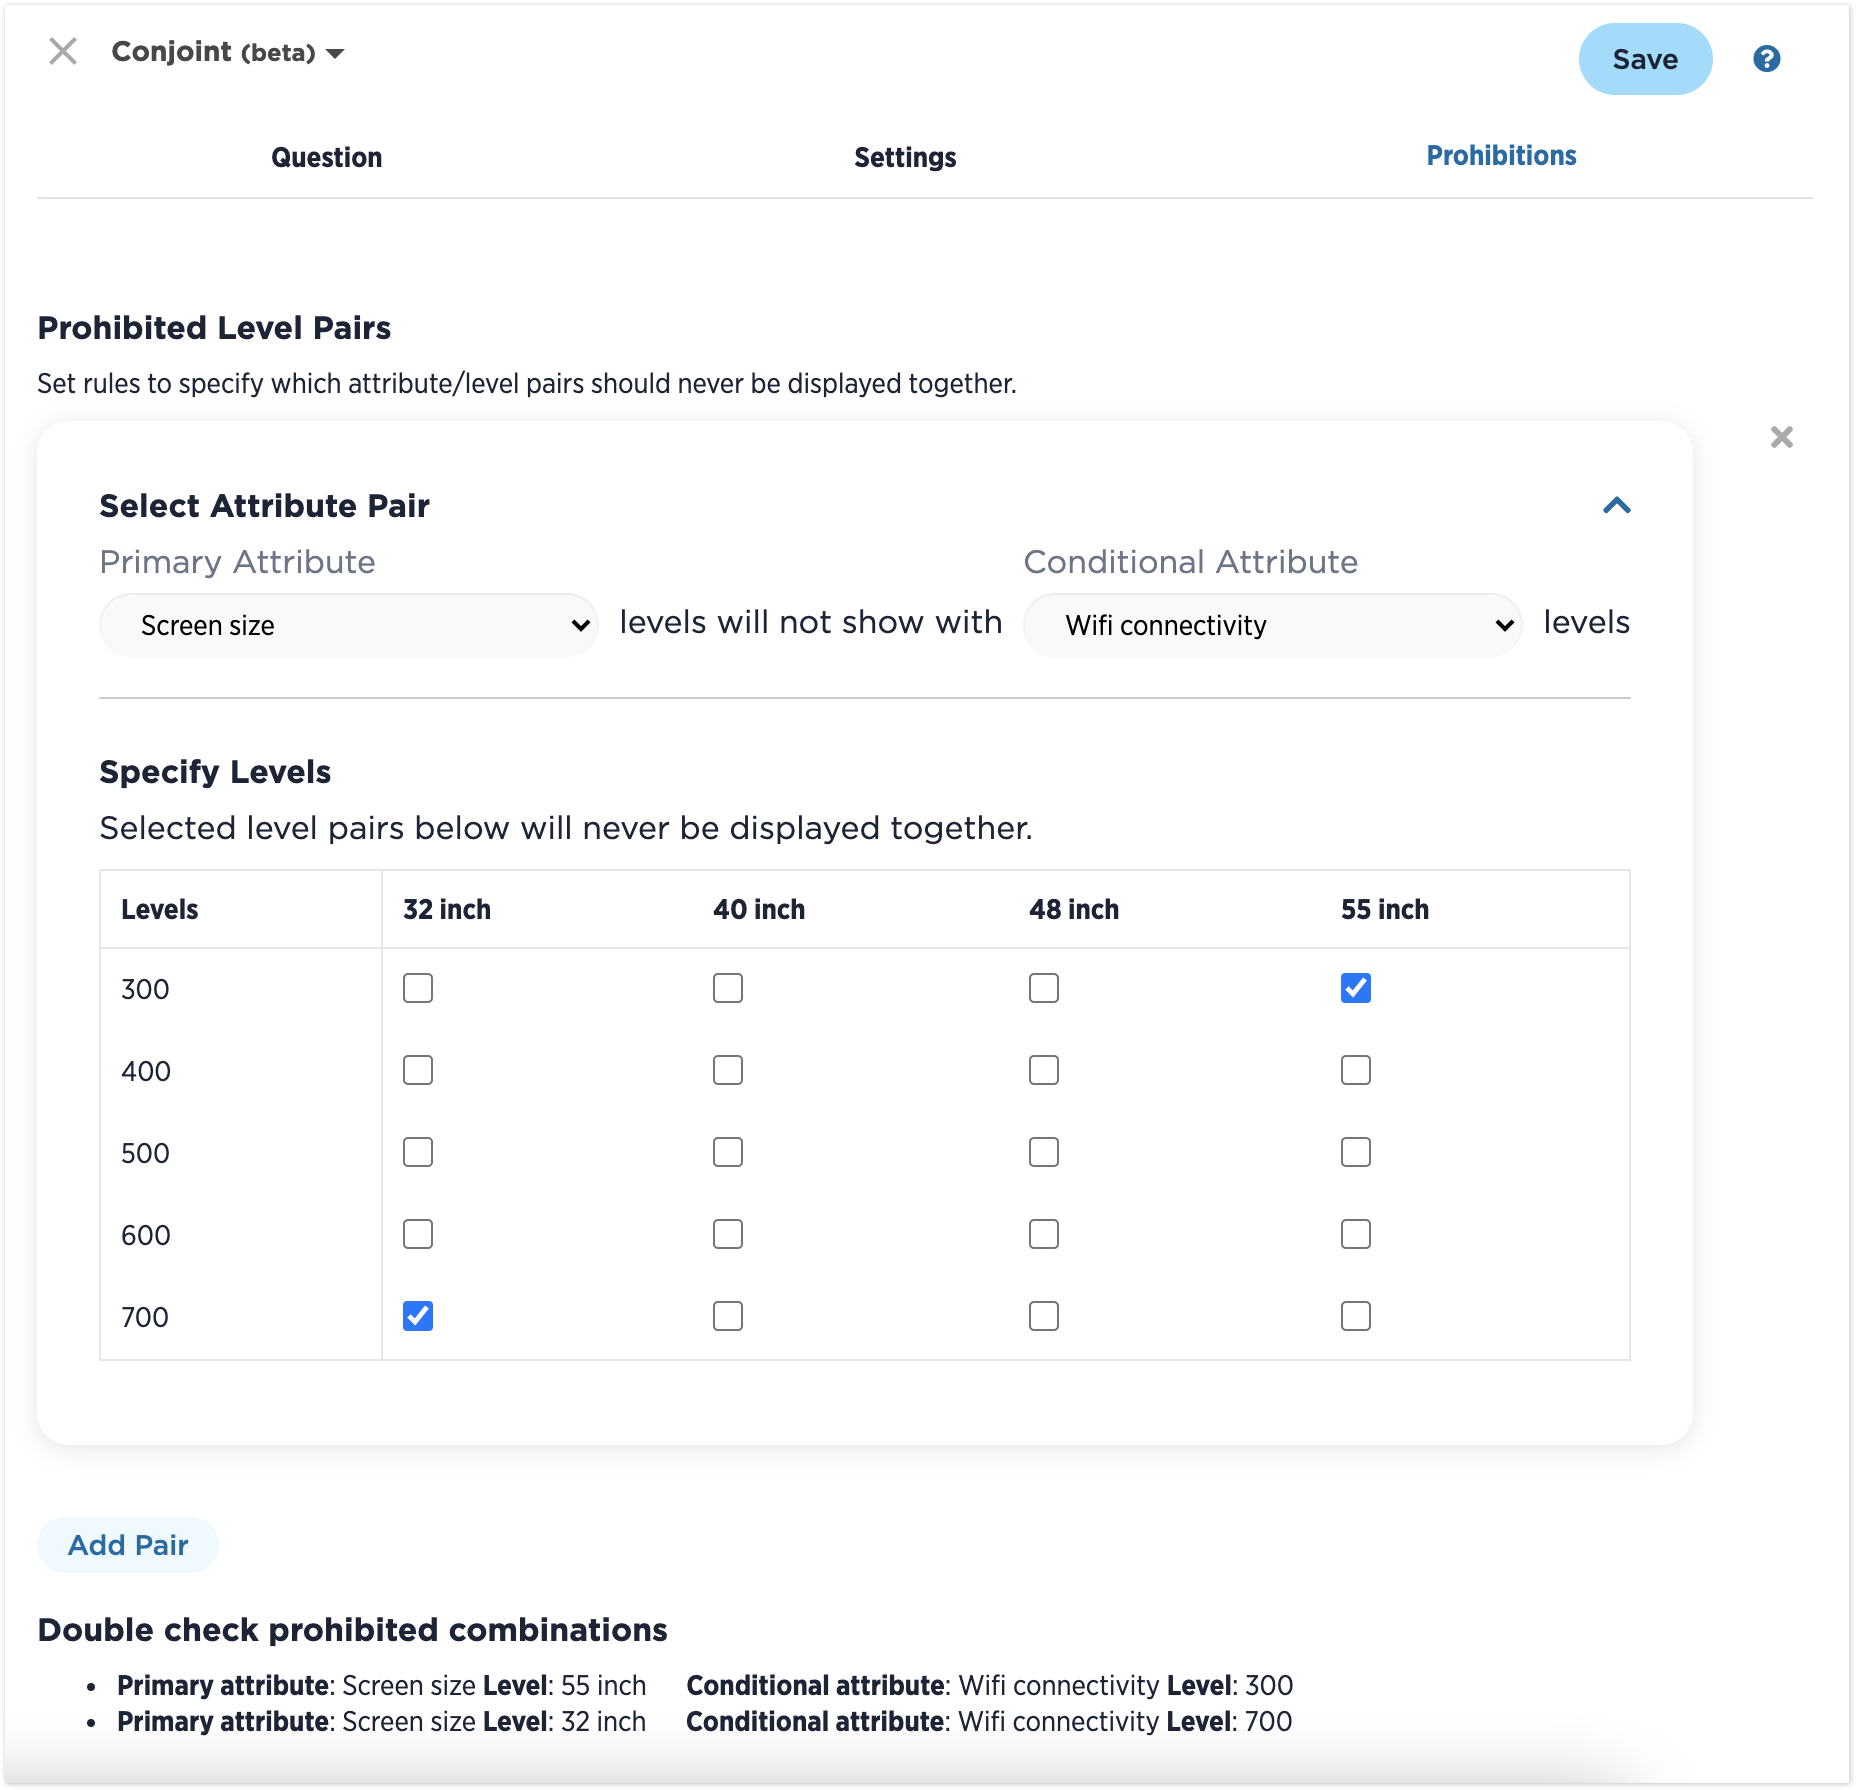
Prohibitions Tab
The admin has the ability to set rules that prohibit selected attribute’s levels to ever be displayed on a card together.
The user will select two attributes at a time. Once the two attributes are selected, a grid with all the levels for each attribute will be displayed. Here, the user has the ability to select the combinations of levels that should never appear together in a concept card.
Survey Design
Once the question is saved, a sample version of the Conjoint is shown in Survey Builder as follows.
The survey design will begin processing in the background. You will receive a notification once the design has been fully processed and the survey is ready to be launched.
Experimental Design
The experimental design is a critical component of Conjoint. The experimental design reduces the full range of possible combinations of attributes and levels to a statistically representative set. Without this step, the number of possible combinations would be too great.
The design determines the layout of each card, including which attribute/level combinations will be shown in the questions presented to respondents.
The experimental design ensures balance and orthogonality; each level is shown an equal number of times (balance) and each level of every attribute is shown an equal number of times with each level of other attributes (orthogonality). The designs generated are D-efficient designs that ensure accurate unbiased estimation of main effects.
Language Support
As always with CheckMarket, language support and translations for the Conjoint question type is also available.

Simulator
With the new CBC Analysis Simulator capability, located in the Analyze tab, you will have the ability to simulate how respondents could potentially react to different product and service offerings. The Conjoint Simulator section will only appear when the survey has a conjoint question in it, and will only be available once the survey is closed and the data is processed.
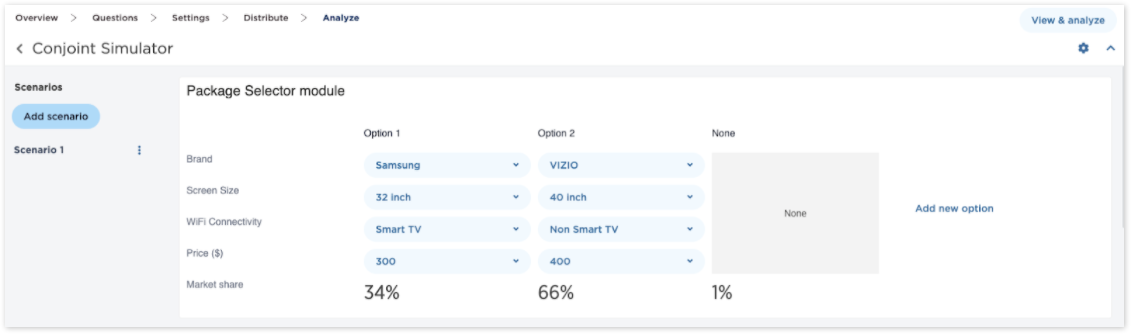
The admin will be able to select up to 20 different product offering combinations, customizing each option based on the attribute and their corresponding levels that were analyzed as part of the Conjoint survey. The Simulator will use the data collected from the survey respondents to provide insights about the particular options the admin has selected.
This simulation reporting will allow admin users to compare these options to understand things like preference share, feature importance, revenue projection, and demand estimation.
- Preference Share: This report uses a vertical bar chart to illustrate the total preference/utility being created by the package being tested in the simulator. The better performing a package will be for your customers, the more preference share it will control. This will be reflected as a higher percentage in the bar graph.
- Feature Importance: This report uses a stacked bar chart to illustrate the amount of preference share being contributed by each of the individual features. The greater the feature importance score is for an option, the more it added to the option’s preference share in comparison to the other features.
- Revenue Projection: This report displays your projected revenue for selected product offerings at each price point. This graph will only be available if the Conjoint question contains a “none” option and a price attribute.
- Demand Estimation: This report displays how your preference share (demand) is affected by price/price variation. With this graph, you can determine when your price or price multiplier is getting too high and affecting demand. This graph will only be available if the Conjoint question contains more than one option and a price attribute.
After running the Simulator, the admin will be able to download the results into a PDF and Excel file, and will also be able to share externally via a hyperlink that the Simulator will generate.
Reporting
When it comes to reporting on your Conjoint question types, there is a new reporting element – “Conjoint Summary” – that will be added by default to the Smart Report, and can be added to Blank Reports as well. This reporting element will present the preference share for conjoint attributes and levels.
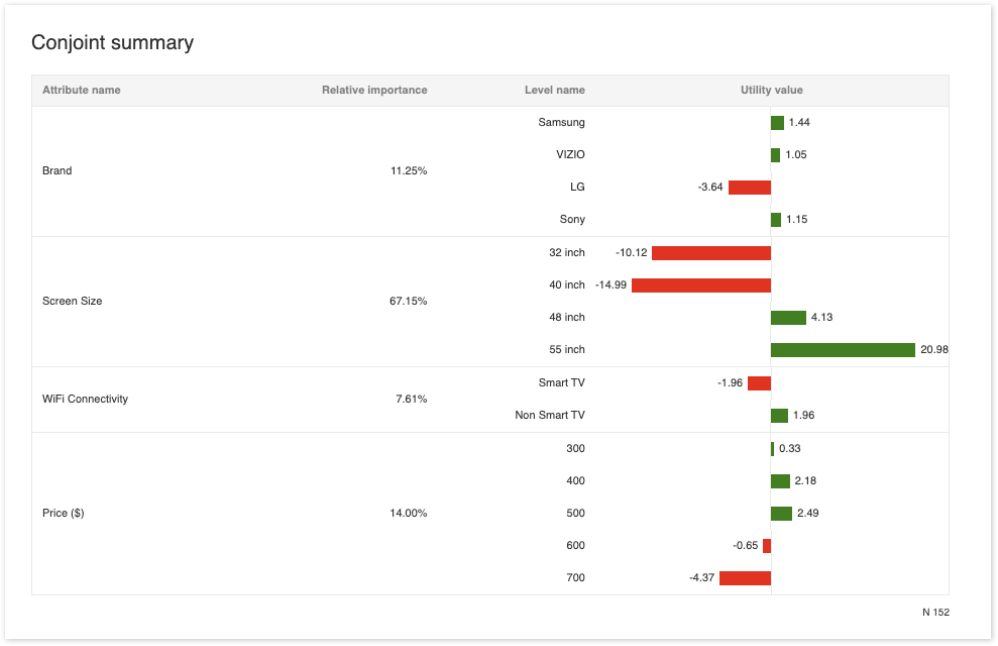
This view can be edited to include metrics around the relative attribute importance and utility value of each attribute/level combination. Anytime you change the data elements on the page, you could either export this report as an image or as an excel download.
Downloads
You can download Conjoint results in two ways.
Firstly, the “Conjoint Details” report. The Conjoint Details report allows the admin to see the experimental design and versions as well as the respondent selections based on the version made available to the respondent. This includes exporting respondent level metrics (utilities, relative importance) for use in further analysis (for e.g. segmentation). This report will download in an XLS format containing four tabs: Utility Scores, Raw Scores, Design, and Versions.
Secondly, you can download the raw data of the Conjoint report into a CSV or XLS format to perform further analysis if needed.
Happy Researching!
We hope you’re as excited as we are about the different research avenues awaiting you with Conjoint.
Dive into CheckMarket now to try out the new functionality for yourself.
Alternatively, if you’re not already using CheckMarket, what are you waiting for?
CheckMarket offers a friendly, modern platform that focuses on engaging an audience and bringing in comprehensive and actionable feedback.
Laisser un commentaire